During each testing cycle, the application performs several tests: sending and receiving TCP data, sending and receiving UDP data, and sending and receiving a time probe packet. Based on these tests, it computes TCP and UDP upstream and downstream throughput values (current, for the latest test, and averaged, for all tests), as well as the round-trip time.
When all tasks in a cycle are completed, a new cycle automatically begins. If the Protocols selection on the Dashboard is set to TCP Only or UDP Only, then the UDP part or TCP part, respectively, is skipped. Naturally, if the UDP part is skipped, all the UDP-based metrics—UDP throughput, UDP packet loss, and jitter—will not be available.
Throughput (also often referred to as "goodput") is the amount of application-layer data delivered from the client to the server (upstream) or from the server to the client (downstream) per second. Protocol overhead is not included. For example, when we refer to a TCP throughput rate of 1 Mbps, it means that 125 Kbytes of actual data payload were sent between two network nodes during one second, excluding TCP, IP, and Ethernet or 802.11 headers.
Packet loss is applicable to UDP tests only, because in TCP, all packets must be acknowledged, and no data loss can occur. UDP loss is calculated as the percentage of data lost during transmission. For example, let's interpret the following result:
UDP Down: 60.00 Mbps (Avg: 55), Loss: 40.0%
This means that during the latest test cycle, the server sent 10 megabits of data in 100 milliseconds (which translates to 100 megabits per second; actual data amounts and durations may vary--this is just an example), and the client received 6 megabits in 100 milliseconds, while 4 megabits were lost en route.
Some UDP loss is quite common and doesn't necessarily indicate a problem with your network. Refer to the Dealing with Common Problems chapter for a detailed discussion.
Round-trip time (RTT) is the length of time it takes for a data packet to be sent from the client to the server and back. The application uses TCP packets for RTT measurements, which is normally a bit slower than the standard ICMP ping.
Jitter refers to the variation in packet arrival times, measured as the difference between successive packets' delay. High jitter can cause issues in real-time applications like VoIP and video streaming, where consistent timing is crucial. Tessabyte calculates jitter using the widely accepted method outlined in RFC 3550, which defines it as the mean deviation of packet delay variation. To illustrate the concept, consider the following chart:
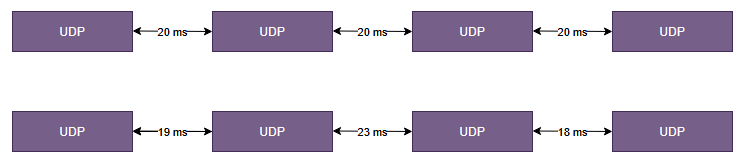
On the sender's side, an application, such as a VoIP phone, transmits UDP packets every 20 milliseconds. On the receiver's side, an application receives these UDP packets. In an ideal world, the inter-packet intervals on the receiver's side remain equal at 20 milliseconds. However, in reality, these intervals deviate from the expected 20 milliseconds—some packets arrive faster, while others may be delayed. This variation is known as jitter. Lower jitter values indicate a more stable network connection, while higher values may suggest congestion or network instability.
| Application | Acceptable Jitter (ms) |
|---|---|
| VoIP | <30 ms (Ideal: <10 ms) |
| Video Conferencing (Zoom, Teams, etc.) | <40 ms |
| Online Gaming | <30 ms (Ideal: <10 ms) |
| Live Streaming (Twitch, YouTube Live, etc.) | <50 ms |
| Standard Video Streaming (Netflix, YouTube, etc.) | <100 ms |